| |
🔍 Quick Snapshot
|
|
This month’s numbers tell a fascinating story. While inventory is climbing across the Tri-Cities, prices are softening and buyer behavior is shifting—especially in higher-priced areas. Here’s a deep dive into what’s really happening in the detached housing market across Coquitlam, Port Coquitlam, and Port Moody.
|
|
Region
|
Benchmark Price
|
YoY Change
|
Sales
|
Active Listings
|
Avg. Days on Market
|
Sales-to-Active Ratio
|
|
Burnaby East
|
$765,900
|
-1.9%
|
16
|
105
|
24
|
15.2%
|
|
Burnaby North
|
$721,200
|
-4.7%
|
81
|
554
|
35
|
14.6%
|
|
Burnaby South
|
$795,500
|
-6.3%
|
73
|
473
|
35
|
15.4%
|
|
|
|
|
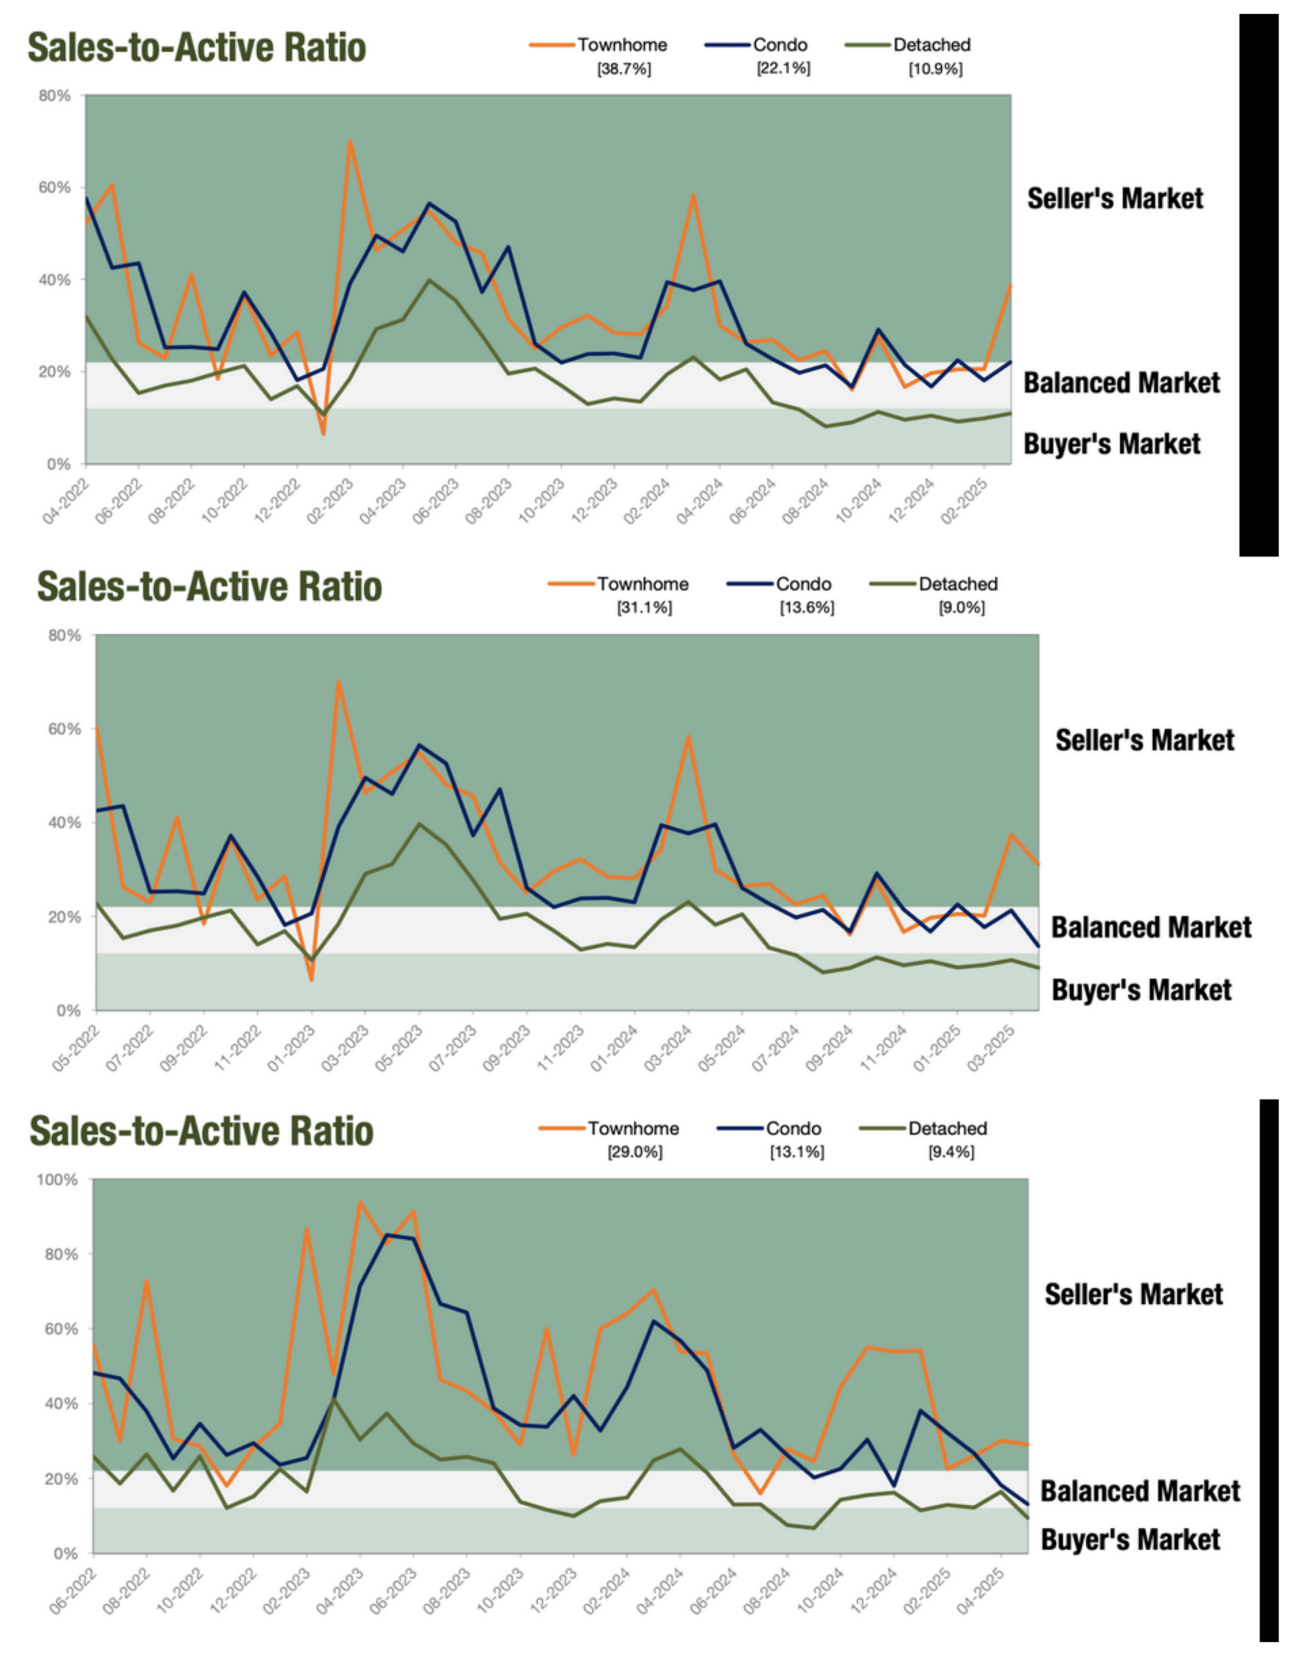
💡 Key Insight: All three regions are in balanced territory, with sales-to-active ratios hovering just above 15%. However, prices are trending downward across the board.
|
|
|
📉 Benchmark Prices & Year-over-Year Trends
|
-
Burnaby South holds the highest condo benchmark price at $795,500, though it saw the steepest decline at -6.3% year-over-year
2025-08-Burnaby-South
.
-
Burnaby East comes next at $765,900, with a more modest -1.9% drop
2025-08-Burnaby-East
.
-
Burnaby North saw the largest inventory but also the largest drop in value, with benchmark prices falling -4.7% to $721,200
|
|
|
🛒 Market Activity
|
🏢 Sales Volume
|
-
North Burnaby led with 81 condo sales, followed by South Burnabywith 73, and East Burnaby with just 16.
-
The low sales in East Burnaby suggest softer demand in that sub-market, or limited new listings appealing to buyers.
|
📈 Inventory & Sales-to-Active Ratios
|
-
East Burnaby: 105 listings, 15.2% ratio
-
North Burnaby: 554 listings, 14.6% ratio
-
South Burnaby: 473 listings, 15.4% ratio
|
|
Although all three are technically in balanced market range, the large inventory in North and South Burnaby means more choice for buyers and potential for further price adjustments.
|
|
|
|
|
|
|
⏱️ Days on Market
|
-
Burnaby East saw condos stay on the market for an average of 24 days, while both North and South Burnaby averaged 35 days.
-
These longer timelines compared to last year indicate a slower pace of sales, reinforcing the shift toward a buyer-friendly environment.
|
|
|
|
|
|
|
📊 Neighbourhood Highlights
|
🔹 Burnaby East
|
-
Highest Condo Activity: Edmonds (16 sales)
-
Benchmark Price (Edmonds): $767,500 (-2.4%)
-
Lowest Activity: The Crest (no condo sales recorded)
2025-08-Burnaby-East
|
🔹 Burnaby North
|
-
Hotspots: Brentwood Park (45 sales), Simon Fraser University area (11 sales)
-
Benchmark Price: Brentwood Park at $785,200 (-5.2%)
2025-08-Burnaby-North
|
🔹 Burnaby South
|
-
Most Active: Metrotown (47 sales), Highgate (12 sales)
-
Benchmark Prices: Metrotown $845,800 (-8.7%), Highgate $731,200 (-1.0%)
|
|
📌 Burnaby South has consistently held the highest values but also experienced the sharpest downward adjustment in the past 12 months.
|
|
|
🔮 Final Thoughts & Tips for Buyers/Sellers
|
🏡 For Buyers:
|
-
Opportunity is knocking. With increasing inventory and downward pressure on prices, this could be a prime time to negotiate.
-
Areas like Burnaby North and South offer the most selection, especially in neighborhoods like Brentwood and Metrotown.
|
💼 For Sellers:
|
-
Strategic pricing is critical. Properties that sit too high above benchmark are staying on market longer.
-
Staging, marketing, and accurate comparables will be more important than ever as buyers take their time and compare options.
|
|
|
|
|
📞 Ready to Navigate This Market?
|
|
Whether you're buying, selling, or just staying informed, I'm here to guide you through every step. Reach out for:
|
-
A personalized market analysis of your neighborhood
-
Early access to off-market listings
-
Tailored selling strategies for this shifting market
|
Let us know which market would you like to know more about next, simply email your preferred city or area to Contact@fartash.ca
|
 |
|
Fartash Elyasi | REALTOR® | RE/MAX Heights Realty
|
|
|
📧 contact@fartash.ca
🌐 fartash.ca
📱 236-885-4669
|
|
Let’s make your next real estate move a confident one.
|
|
|
|
|
|
DISCLAIMER:
All market data presented in this newsletter is sourced from the Real Estate Board of Greater Vancouver (REBGV) and reflects statistics current as of September 3, 2025, based on August 2025 market activity. Benchmark prices, sales figures, and other indicators are calculated using REBGV methodologies and rounded where applicable. This information is provided for general informational purposes only and should not be relied upon as financial, legal, or real estate advice. Readers are encouraged to consult with a licensed REALTOR® or appropriate professional for personalized guidance.
|
|
|
|
